Advertisements
IELTS Task 1:
How to respond when given 2 data sources
Article contributed by Ryan Higgins, ieltsielts.com
One of the most common questions I am asked as an IELTS instructor is how to link multiple data sources together. Often, students find it difficult to express the relationship between more than 1 data source. In this article, written exclusively for www.ExamEnglish.com, I am going to offer some insights regarding Task 1 response writing when given more than 1 data source to analyze.
To get us started, let’s look at the following example table and graph:
Glasgow age demographics (1998)
|
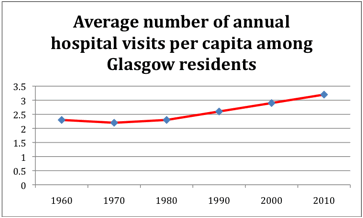 |
When looking at these 2 data sources, a few things should jump out as us. Firstly, according to the table, in 1998 Glasgow had a population that was heavily weighted with people aged between 35 and 64. Many would rightfully call this an aging population. Our graph shows a steady rise in average annual hospital visits between 1980 and 2010. So the obvious link between the 2 data sources is that as Glasgow residents get older, hospital visitation increases.
Students rarely have problems making these sorts of connections between data. They do have problems, however, when it comes to relaying this information accurately in writing. So what is the ideal Task 1 structure when you are given multiple data sources?
The best way to respond to a Task 1 question is to allot a paragraph to each data source and an additional paragraph to describing the relationship between them. Thus, in the case of this table and graph, our basic Task 1 writing structure is going to have 3 paragraphs and look like this:
Paragraph 1 – Analyzing data source 1 (table)
- A sentence describing the first data source and the broad trend it depicts
- A sentence outlining the minor and minute details of the data source
- Another sentence outlining the minor and minute details of the data source (if needed)
Paragraph 2 – Analyzing data source 2 (graph)
- A sentence describing the second data source and the broad trend it depicts
- A sentence outlining the minor and minute details of the data source
- Another sentence outlining the minor and minute details of the data source (if needed)
Paragraph 3 – Brief description of the relationship between the data types
- A sentence explaining the relationship between the sources
- A sentence for further explanation (if needed)
- A sentence elaborating or commenting on what this relationship means or what perhaps caused it
- A sentence summarizing, predicting or commenting on the data presented
In both paragraph 1 and 2, we are simply going to recite each data source individually, stating precisely what each source shows. In paragraph 3, we interpret the data source relationship.
So, in the case of our Glasgow example above, we’d write our response something like this:
The table presents Glasgow age demographics in 1998 and appears to reveal an aging population within the city. Children and teenage Glasgow residents make up 14 and 12 percent of Glasgow’s overall population respectively. People between 20 and 34 account for 16 percent of the total Glasgow population and this figure grows by increments of 4 percent for the following 2 demographics, those between 35 and 49 and those between 50 and 64. The elderly demographic is equal to that of Glasgow children.
The chart shows the average annual number of hospital trips a Glasgow person makes. The figures given between 1960 ad 1980 appear to only waver slightly, at roughly 2.3 trips per year. However, a steady climb is seen over the next 30 years, with Glasgow people ultimately reaching 3.2 annual hospital visits in 2010.
What you can see above is a clear picture of both data sources. By simply reading the description, a person could recreate the table and graph this data comes from.
Now to show the relationship between the 2 data sources, we would commence writing our third paragraph:
It is clear when looking at the table and graph comparatively that Glasgow has an aging population and that this is cause for the increased annual hospital visits. It is assumed baby-boomers play cause to this abnormal weighting. As these older Glasgow demographics continue to age, it is expected that the annual number of hospital visits will also rise.
What you can see here is 3 sentences. The first outlines the nature of the relationship between the 2 data sources. The second provides a quick comment on the possible cause and the third gives a prediction for what the future of the data might look like.
Thus basically our overall response involves 2 paragraphs that present information and 1 paragraph that interprets it. Let’s read through our entire response from start to finish:
The table presents Glasgow age demographics in 1998 and appears to reveal an aging population within the city. Children and teenage Glasgow residents make up 14 and 12 percent of Glasgow’s overall population respectively. People between 20 and 34 account for 16 percent of the total Glasgow population and this figure grows by increments of 4 percent for the next 2 demographics, those between 35 and 49 and those between 50 and 64. The elderly demographic is equal to that of Glasgow children.
The chart shows the average annual number of hospital trips a Glasgow person makes. The figures given between 1960 ad 1980 appear to only waver slightly, at roughly 2.3 trips per year. However, a steady climb is seen over the next 30 years, with Glasgow people ultimately reaching 3.2 annual hospital visits in 2010.
It is clear when looking at the table and graph comparatively that Glasgow has an aging population and that this is cause for the increased annual hospital visits. It is assumed baby-boomers play cause to this abnormal weighting. As these older Glasgow demographics continue to age, it is expected that the annual number of hospital visits will also rise.
As you can see, responding to Task 1 questions that pose more than 1 data source are much easier when you employ an effective writing structure.
Good luck with your exam!
Advertisements
2019 © Exam English Ltd. ALL Rights Reserved. Terms of Use | Privacy policy | Links | español | français | 中国的 | IELTS | Oxford Collocation Dictionary | Power Dictionary